Retail Software
 Distribution Software
 Retail Chain

35 Key Inventory Management KPIs Every Business Should Track in 2026


Have you ever waited in front of an empty shelf while a customer has gone home without buying anything because you are missing just one piece of merchandise? That’s usually not bad luck. It’s a KPI you weren’t watching.
Inventory isn’t just boxes on a rack. It’s cash, frozen in a physical shape, and every day it sits there unsold or gets miscounted, you’re bleeding money in ways that don’t show up until the month-end report lands on your desk and you’re left wondering where the margin went.
Most business owners track the obvious stuff, total sales, maybe stock on hand, and stop there. Real inventory control means watching a wider set of numbers that explain not just what’s happening on your shelves, but why, and what you should actually do about it. Below are 35 inventory Management KPIs, split into seven groups that make sense together, instead of one long list where “labor cost per hour” sits next to inventory turnover ratio as they belong in the same breath.
And where it’s useful, we’ll point to where inventory tracking software India businesses actually rely on, Margbooks included, takes the manual math out of your hands.
So, What Is an Inventory KPI Anyway?
A KPI (key performance indicator) is just a number tied to a goal. For inventory, that could be how fast stock moves, how accurate your counts are, what it costs you to hold unsold goods, or how long it takes a product to travel from a supplier’s warehouse to a customer’s doorstep.
Here’s the thing people miss: every KPI is a metric, but not every metric deserves to be called a KPI. If you’re tracking twenty numbers and none of them change a single decision you make, you’re not managing inventory. You’re just collecting spreadsheets.
How Should You Actually Measure Inventory Performance?
Instead of categorizing everything in a single large category, you should think about differentiating your work based on the type of work done. That’s the approach here, seven groups, five KPIs each, roughly:
- Stock & Turnover
- Sales & Demand Forecasting
- Cost & Profitability
- Warehouse & Receiving
- Order Fulfillment & Customer Service
- Accuracy & Loss Prevention
- Workforce & Operational Efficiency
Each group answers a different question you’d actually ask your team. None of them is so big that you get lost trying to act on all of it at once.
Category 1. Stock & Turnover KPIs
These tell you whether your stock is flying off the shelves or just… sitting there.
1. Inventory Turnover Ratio: How many times you sell and replace your stock in a year. Too low, and you’re overstocked. Too high, and you’re probably running out of things you shouldn’t. Formula: Cost of Goods Sold ÷ Average Inventory
2. Days Inventory Outstanding (DIO) Also called Days on Hand, the average number of days it takes to clear your stock. Formula: (Average Inventory ÷ Cost of Sales) × 365
3. Weeks on Hand Same idea as DIO, but weekly, which suits businesses that restock often, grocery chains, FMCG distributors, that sort of thing. Formula: (Average Inventory ÷ Cost of Sales) × 52
4. Stock-to-Sales Ratio Compares how much you’re holding against how much you’re actually selling. Catches overbuying before it turns into a cash crunch. Formula: Inventory Value ÷ Sales Value
5. Sell-Through Rate A blunt but honest number: what percentage of received stock has actually sold. Formula: (Units Sold ÷ Units Received) × 100
6. Average Inventory Smooths out the seasonal spikes so you’re not fooled by one good month. Formula: (Beginning Inventory + Ending Inventory) ÷ 2
7. Inventory-to-Sales Ratio Tracked over time, this one catches a trend early — is your stock piling up faster than your sales are growing? That’s usually the first sign of trouble. Formula: Ending Inventory ÷ Net Sales for the Period
If you’re running a supermarket or garment store juggling dozens of categories, an inventory management software that recalculates these numbers on its own beats redoing an Excel sheet every Sunday night.
Category 2. Sales & Demand Forecasting KPIs
Predicting what customers want before they ask for it.
8. Demand Forecast Accuracy: How close your predictions came to actual sales. Keeps your buying decisions honest. Formula: [(Actual Sales − Forecast) ÷ Actual Sales] × 100
9. Backorder Rate: The share of orders you couldn’t fill right away because you didn’t have the stock. Formula: (Delayed Orders Due to Backorder ÷ Total Orders) × 100
10. Product Sales (Sales Revenue): Total income from customers, minus returns and discounts. Formula: Gross Sales Revenue − Returns − Discounts − Allowances
11. Revenue per Unit: How much value one unit generates. Handy for subscription businesses or anyone selling in bulk. Formula: Total Revenue ÷ Average Units Sold
12. Sell-Out Rate Different from sell-through, this tracks how fast product moves once it’s in the end customer’s hands, which matters a lot if you sell through distributors or retail chains rather than directly. Formula: (Units Sold to End Customer ÷ Units Shipped to Retail Partners) × 100
If a good chunk of your demand comes through Amazon, Flipkart, or Meesho, syncing orders through e-commerce distribution software means you’re forecasting off real numbers, not gut feel.
Category 3. Cost & Profitability KPIs
The numbers that tell you whether inventory is actually generating a profit, not just moving.
13. Gross Margin by Product Profit: Each product line generates profit after direct costs. Formula: [(Net Sales − Cost of Goods Sold) ÷ Net Sales] × 100
14. Gross Margin Return on Investment (GMROI): How efficiently your inventory is spent to turn into profit. Formula: Gross Margin ÷ Average Inventory Cost
15. Cost per Unit: What it costs to produce or buy a single unit. Basic, but easy to get wrong if you’re not careful with fixed costs. Formula: (Fixed Costs + Variable Costs) ÷ Units Produced
16. Inventory Carrying Cost: The slice of total inventory value you spend just storing and maintaining stock, rent, insurance, labor, spoilage, all of it lumped together. Formula: [(Storage + Risk + Capital + Service Costs) ÷ Total Inventory Value] × 100
17. Rate of Return (ROR): A wider profitability check on your inventory investment over time. Formula: [(Final Value − Initial Value) ÷ Initial Value] × 100
For distributors running thin margins across bulk stock, pharma, FMCG, hardware, accounting software that ties GST records straight to stock costs saves you a whole separate spreadsheet for profitability.
Category 4. Warehouse & Receiving KPIs
The behind-the-scenes details that determine how smoothly stock actually gets to the door.
18. Time to Receive: How long it takes to validate, log, and prep new stock once it arrives. Formula: Time to Validate + Time to Record + Time to Prep for Storage
19. Put-Away Time: Time to physically move received goods into storage. Formula: Total Time to Stow Received Stock
20. Supplier Quality Index (SQI) A weighted score of how reliable a supplier actually is, including delivery quality, response time, product condition, and so on. Formula: (Material Quality × Weight) + (Delivery Quality × Weight) + (Reply Time × Weight) + …
21. Warehouse Space Utilisation: How much of your warehouse storage is actually being put to good use? Many lists forget about this point, which is key because otherwise you would be wasting your money by paying rent for storage space. Formula: (Occupied Storage Space ÷ Total Available Space) × 100
22. Internal WMS Efficiency (ROI) Once you’ve spent money on a warehouse or inventory system, this tells you if it’s paying for itself. Formula: (Gain on Investment − Cost of Investment) ÷ Cost of Investment
Category 5. Order Fulfillment & Customer Service KPIs
These are the ones your customers actually feel, even if they never see the number.
23. Perfect Order Rate: Orders delivered on time, complete, undamaged, and correctly documented — all four conditions, or it doesn’t count. Formula: (On-Time % × Complete % × Damage-Free % × Accurate Docs %) × 100
24. Order Cycle Time: Average time between a customer placing an order and getting it in hand. Formula: (Time Order Received − Time Order Placed) ÷ Total Orders Shipped
25. Fill Rate: How much of a customer’s order you actually fulfilled from stock on hand. Formula: [(Total Items − Shipped Items) ÷ Total Items] × 100
26. Lead Time Full time from order placed to delivery, processing, production, shipping, the whole chain. Formula: Order Processing Time + Production Time + Delivery Time
27. Service Level Percentage of orders fulfilled without a stockout getting in the way. Formula: (Orders Delivered ÷ Orders Received) × 100
Retail chains with multiple outlets usually struggle here for one reason: stock isn’t visible across branches. Retail chain management software that centralizes inventory across locations makes hitting these numbers a lot less painful.
Category 6. Accuracy & Loss Prevention KPIs
The metrics that catch problems quietly eating your margins before they become a real headache.
28. Inventory Shrinkage The gap between what your books say you should have and what’s actually on the shelf, theft, damage, miscounts, take your pick. Formula: Ending Inventory Value, Physically Counted Inventory Value
29. Available Inventory Accuracy: How well your electronic records match a physical count. Formula: (Counted Items Matching Records ÷ Total Counted Items) × 100
30. Stock-Outs Percentage of orders you couldn’t fill because an item just wasn’t there. Formula: (Items Out of Stock ÷ Items Shipped) × 100
31. Dead Stock / Spoilage Rate: Stock that’s probably never selling, or has already expired. Businesses sitting above 25–30% dead stock usually have a deeper purchasing problem to fix, not just a clearance sale to run. Formula: (Unsellable Stock ÷ Total Available Stock) × 100
32. Lost Sales Ratio Days a product sat out of stock against its expected sales pace — a decent proxy for revenue you left on the table. Formula: (Days Product Out of Stock ÷ 365) × 100
This is exactly where batch and expiry tracking earns its keep. Pharmacies and supermarkets dealing with perishables or medicines lean on tools like pharmacy software or supermarket software that flag near-expiry stock automatically, instead of finding out once it’s already dead.
Category 7. Workforce & Operational Efficiency KPIs
Because inventory management isn’t just about the stock. It’s about the people moving it around.
33. Labor Cost per Item: Wages spent to produce or process a single unit. Formula: Total Labor Expense ÷ Total Units Handled
34. Labor Cost per Hour: What an employee costs you hourly, useful next time you’re deciding if that hour-long meeting was worth it. Formula: (Annual Gross Salary ÷ Weeks Worked per Year) ÷ Hours Worked per Week
35. Customer Satisfaction Score (CSAT) Not strictly a warehouse number, but a direct reflection of whether your inventory processes are actually serving the people buying from you. Formula: (Positive Responses ÷ Total Responses) × 100
Picking the Right KPIs (Not All 35 at Once)
Thirty-five is a lot. No one should track all of them from day one. A decent rule: pick 5 to 7 per department, tied to whatever problem you’re actually trying to fix right now. Cash stuck in slow-moving stock? Start with turnover ratio, DIO, and dead stock rate. Customer complaints piling up? Look at fill rate, service level, and perfect order rate instead.
Whatever you pick, make sure it:
- Ties to a real decision, not just a report nobody opens
- Is it realistic to measure with the data you already have
- Has one person responsible for improving it
- Gets reviewed on a schedule, not just when something breaks
Why Spreadsheets Stop Working Once You Grow
Plenty of business owners start tracking Inventory Management KPIs in Excel, and honestly, that’s fine when you’ve got fifty SKUs and one shop. It stops being fine the moment you open a second location, start selling on Flipkart alongside your physical store, or bring on a distributor who needs their own view of your stock.
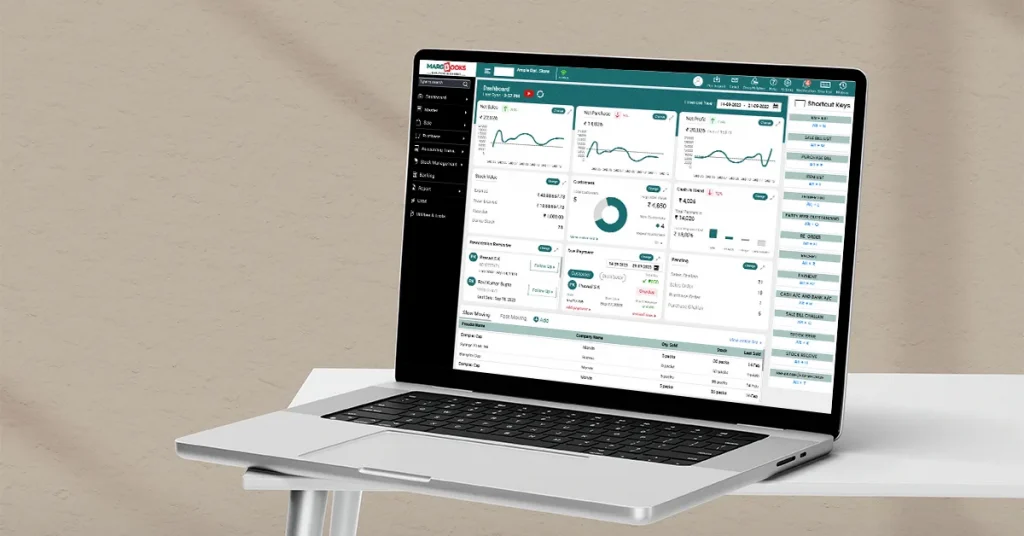
That’s where GST-compliant inventory tracking software India retailers use, Margbooks being one of them, actually earns its place. The numbers update as sales, purchases, and stock transfers happen, instead of you recalculating turnover ratios by hand or figuring out why the physical count never matches the books. Low-stock and near-expiry alerts fire on their own. And since billing and inventory live on the same platform, your GST filing doesn’t quietly fall out of sync with your stock records either.
Distribution businesses running multiple warehouses feel this even more. Distribution software built around godown-level visibility means you’re not calling the warehouse manager just to find out what’s actually on the shelf.
Conclusion
None of this is meant to turn your business into a spreadsheet exercise. These KPIs exist to answer specific, practical questions: Is cash stuck in stock that isn’t moving? Are you losing sales to stockouts? Is your team spending more time fixing count errors than actually helping customers? Pick the few that answer your current biggest problem. Track them properly. Use other techniques until it is the right time to employ them.
And in case you are getting tired of adding turnover rates, carrying charges, and fill rates of different branches by hand, it may be the best time to try some special software for automation. Request a free demo of Margbooks software now to see how you can get rid of spreadsheets.
FAQs
What’s a good inventory turnover ratio?
Depends entirely on the industry. Businesses involved in groceries and those that deal with fast-moving consumer goods experience turnover rates of over 10 times per annum, as there is a constant movement of inventories. However, businesses that deal with heavy-duty equipment or furniture do not need turnover rates of more than 2 to 4 times a year. Always strive to monitor the changing trend of KPIs in comparison to your past performances.
How often should you review these KPIs?
Fast-moving ones, stock-outs, backorder rate, and fill rate are worth checking weekly. Slower ones like carrying cost, GMROI, and dead stock rate don’t shift much day to day, so monthly or quarterly is usually enough.
Can inventory Management KPIs be tracked automatically?
Yes. Most inventory management software calculates these straight from your existing sales, purchase, and stock data, with no manual formula work needed. It’s also just more reliable, since it cuts out the human-error risk that comes with spreadsheet math.
Which businesses get the most out of this?
Anyone holding physical stock benefits, but the payoff is biggest for retailers, distributors, and pharma or FMCG businesses, where stock turns over fast, and margins are thin enough that small inefficiencies add up quickly.

Aman Kannojia is the Digital Team Lead at MargBooks. He started out as an SEO Specialist and never lost his love for words. With 5 years of experience across banking, SaaS, and finance, both domestic and international, he brings strategy, leadership, and storytelling together. He doesn’t just manage a team, he builds one that creates.